
The best way,I found,to trade in the market is to find the ‘sweetspots’ in an uptrending stock or sector/or index! When a stock is in uptrend,it goes through a series of ‘higher highs and higher lows'(pullback) type situation.
Our indicators must be able to detect those ‘higher lows’ areas,where we can re-enter a stock/sector/index. If not,we are doomed!!! We should be able to mitigate the chaos of price movements in a chart and catch the optimal entry positions in an uptrending stock!!!
May be,I should not be too concerned about missing the first move(usually V pattern) of a stock. V is pretty hard and risky pattern to trade. “W” pattern is better than “V”! I should be waiting for the first pullback/sweetspot to appear!!! I have seen in recent times,a lot of stock going through this pullback type situations and gave profit from pullback…ie,SPCL!!
I the issue of missing the first pullback by not being able to detect it on time.Even if I could detect the first ‘pullback’,I would start to doubt its potential,so would not enter…..Very problematic situation.
That is why,I have developed some indicators,with which,I can trade this type of ‘sweetspot’ situations very very well and with ease!!! I found that if a stock is trading in a ‘straight zone'(white line),it means,it is in rest or pullback. And in both situations,there is a high chance that the stock will move further! So,with my new chart setup,it has been easy for me to detect the ‘sweetspots’. Got some fine trade recently in DSE and Forex with the chart setup!
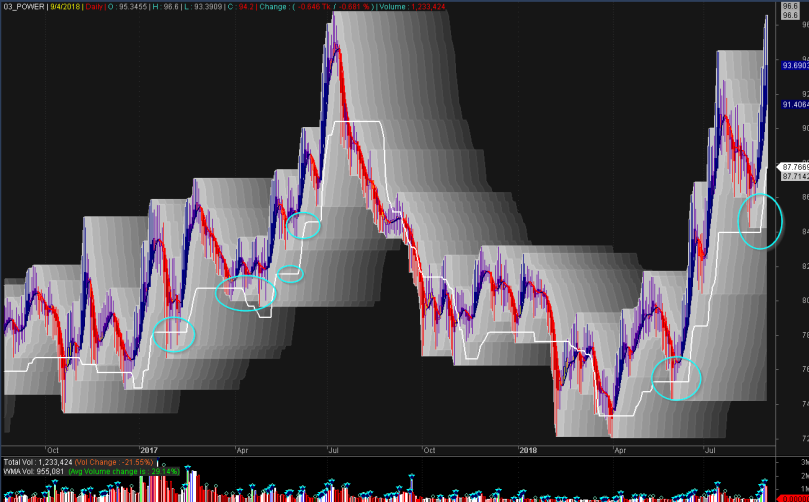
Here is a successful trade by detecting the first pullback/sweetspot….
![2018-09-05 09_49_31-AmiBroker - [SPCL - - Daily]](https://xtrator.wordpress.com/wp-content/uploads/2018/09/2018-09-05-09_49_31-amibroker-spcl-daily.png?w=809)

good to see you again bro 🙂
Looks Great!! I have HH, LH, HL and LL, AFL, and also Cubic Spline AFL But this Sweetspot Indicator of yours looks great. Can you, please kindly share with me this AFL?