Below is the list of patterns,rules(or whatever you call them) that I follow or check before I enter the market or a stock……The mnemonics that I use also has been included:
I call them my ‘checklist for trading”! I don’t think,one can do well in trading(or anything else in life),if one doesn’t have ‘pre-defined’ rules for trading!! A trader without pre-defined,tested rules is a novice,confused,indiscipline trader. It doesn’t matter how long the trader is trading in the market,if he doesn’t know his ‘rules’ of trading well,he is just fucked!
I have kept the ‘mnemonics’ with the rules. These mnemonics are what make me easily recall hundreds of different techniques,rules,ideas or trading experiences I have from real trading……
The patterns:
- Market cycle/phase(ie, Wyckoff method/where the market is at the moment) – Wigs + Cycle+Startrek’s phazer
- Market Structure/Trend(Structured+Dynamic…hiher high,higher lows) – Fly+Train
- Seasonal trading – Scissor
- Candlesticks patterns….(ie,Pinbar/Hammer) – Candle/ Pin+Hammer
- Trend continuation(i.e….pullback type trading) – Train+Con
- Trend termination (reversal..ie.V pattern) – Train+Termite
- Support resistance failure(ie,breakout/breakdown from a range) – Bread
- Support resistance hold(range trading….buy at support and sell at resistance) – Soup +Old
- Contraction and expension – Con+Ex gf
- Impulse+Momentum – Mombati+Pulse machine
- Pullback pattern(simple,classic,complex) – Harpoon
- L pattern – L letter
- W patterns – W letter
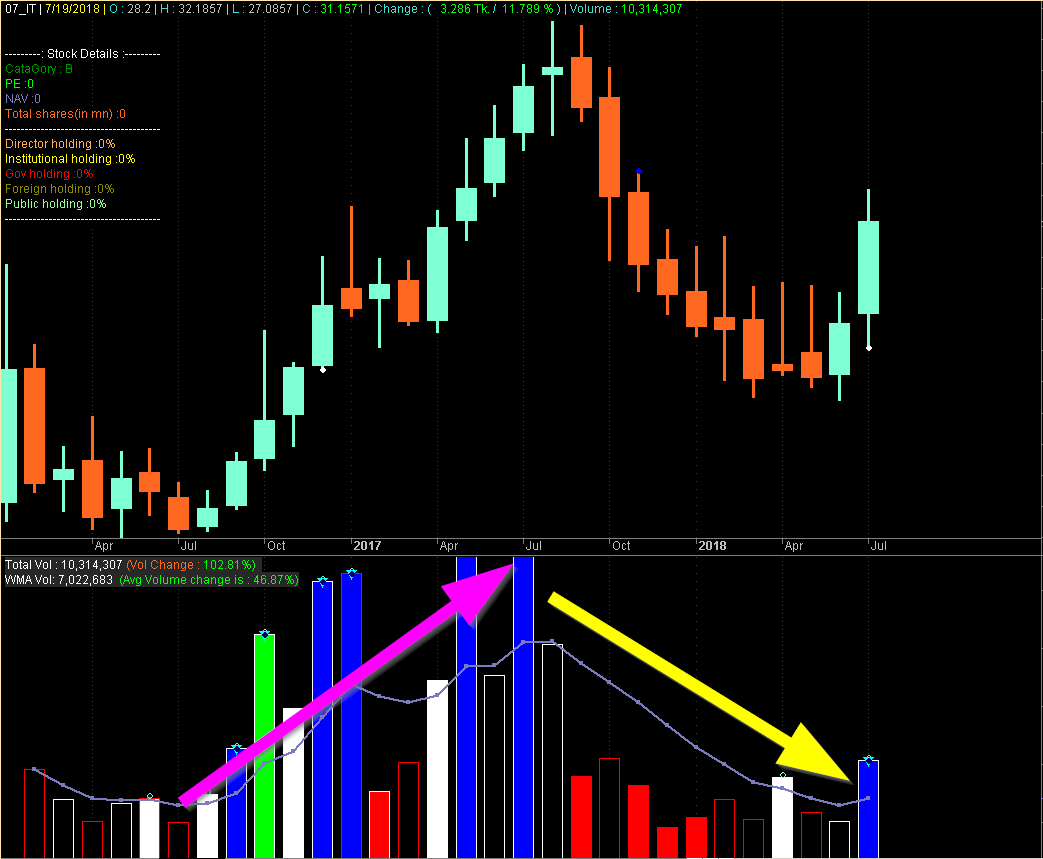
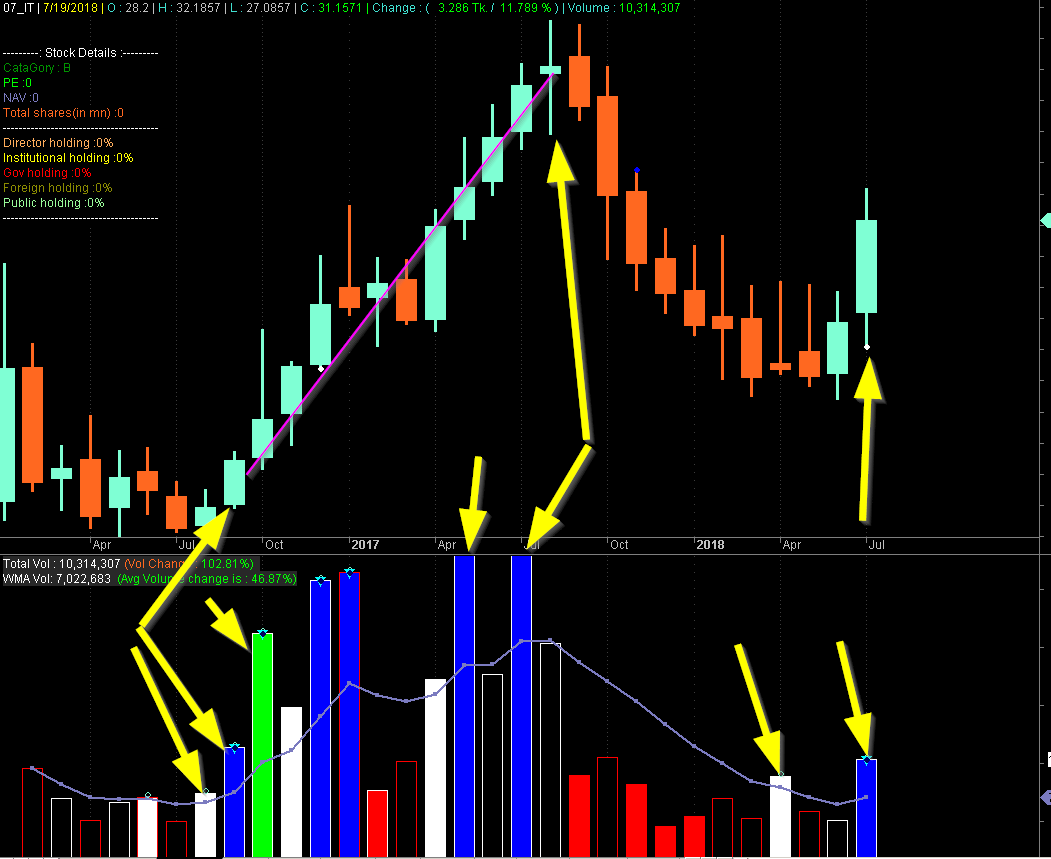
- Volume Spike and Volume Trend – Bulb +Spoke
- Pullback failure – Pully+Tail
- Elastic price pattern – Elastic Man
- First pullback after breakout – Floss+Pully+Bread
- Descending/ascending patterns – Disc+Ace
- Oscillator trading– Pendulam
- Historical breakout – Histacin tablet
- Retesting – Tester/trash
- Extreme Sentiment – Ex girlfriend+Scent
- Value Price – Vulve
- R multiplier – Rainman
Here are other related articles:


![2018-09-05 09_49_31-AmiBroker - [SPCL - - Daily]](https://xtrator.files.wordpress.com/2018/09/2018-09-05-09_49_31-amibroker-spcl-daily.png)
![2018-07-22 09_23_34-AmiBroker - [ALIF - - Daily]](https://xtrator.files.wordpress.com/2018/07/2018-07-22-09_23_34-amibroker-alif-daily.png)
![2018-07-22 09_35_08-AmiBroker - [BDCOM - - Daily]](https://xtrator.files.wordpress.com/2018/07/2018-07-22-09_35_08-amibroker-bdcom-daily.png)
![2018-07-22 09_35_48-AmiBroker - [MHSML - - Daily]](https://xtrator.files.wordpress.com/2018/07/2018-07-22-09_35_48-amibroker-mhsml-daily.png)
![2018-07-22 09_36_15-AmiBroker - [REGENTTEX - - Daily]](https://xtrator.files.wordpress.com/2018/07/2018-07-22-09_36_15-amibroker-regenttex-daily.png)
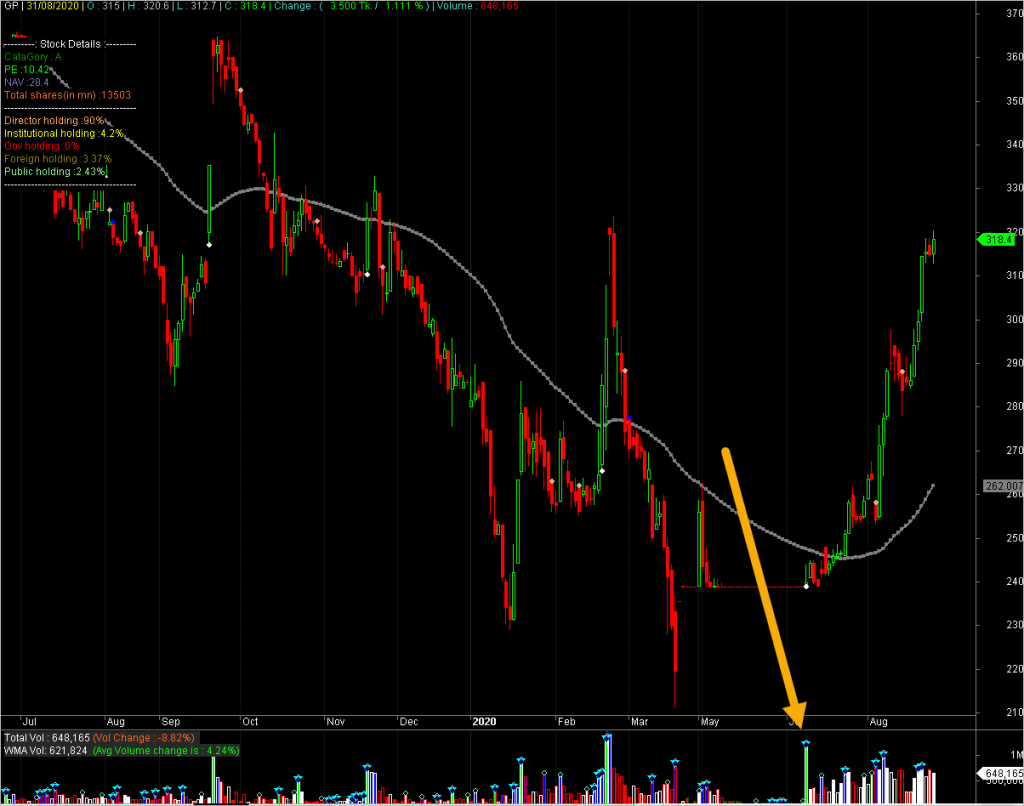
![2018-07-22 09_36_39-AmiBroker - [GP - - Daily]](https://xtrator.files.wordpress.com/2018/07/2018-07-22-09_36_39-amibroker-gp-daily.png)
![2018-07-22 09_37_12-AmiBroker - [OIMEX - - Daily]](https://xtrator.files.wordpress.com/2018/07/2018-07-22-09_37_12-amibroker-oimex-daily.png)
![2018-07-22 09_40_46-AmiBroker - [NAHEEACP - - Daily]](https://xtrator.files.wordpress.com/2018/07/2018-07-22-09_40_46-amibroker-naheeacp-daily.png)